In essence, learning is endlessly complicated – even sometimes more complicated than rocket science. Human cognition is a mix of several systems and their intertwined connections to each other. In fact, neuroscientists, even to this day, are struggling to completely map the human cognitive framework.
Renowned American biologist James D. Watson once quoted: “The brain is the last and grandest biological frontier, the most complex thing we have yet discovered in our universe. It contains hundreds of billions of cells interlinked through trillions of connections. The brain boggles the mind.”
Thankfully, wisdom has been passed down through history, from Aristotle to Pliny the Elder to Sophocles, and so forth. So, what fraction of information do we retain? This can be described as how much people remember:
- 10 percent of what they READ
- 20 percent of what they HEAR
- 30 percent of what they SEE
- 50 percent of what they SEE and HEAR
- 70 percent of what they SAY and WRITE
- 90 percent of what they DO.
This is wisdom that learning professionals should integrate into their learning methods. Unfortunately, the complexities are intimidating. Let’s make the recommendations clearer, based on our current understanding of neuroscience.
The Cone of Experience
First of all, let’s shed some light on the recommendations of American educator Edgar Dale on the basis of his Cone of Experience, also called Learning Pyramid. In the 1940s, Edgar Dale predicted neuroscience findings years before brain imaging techniques came into existence.
Edgar Dale’s Cone of Experience
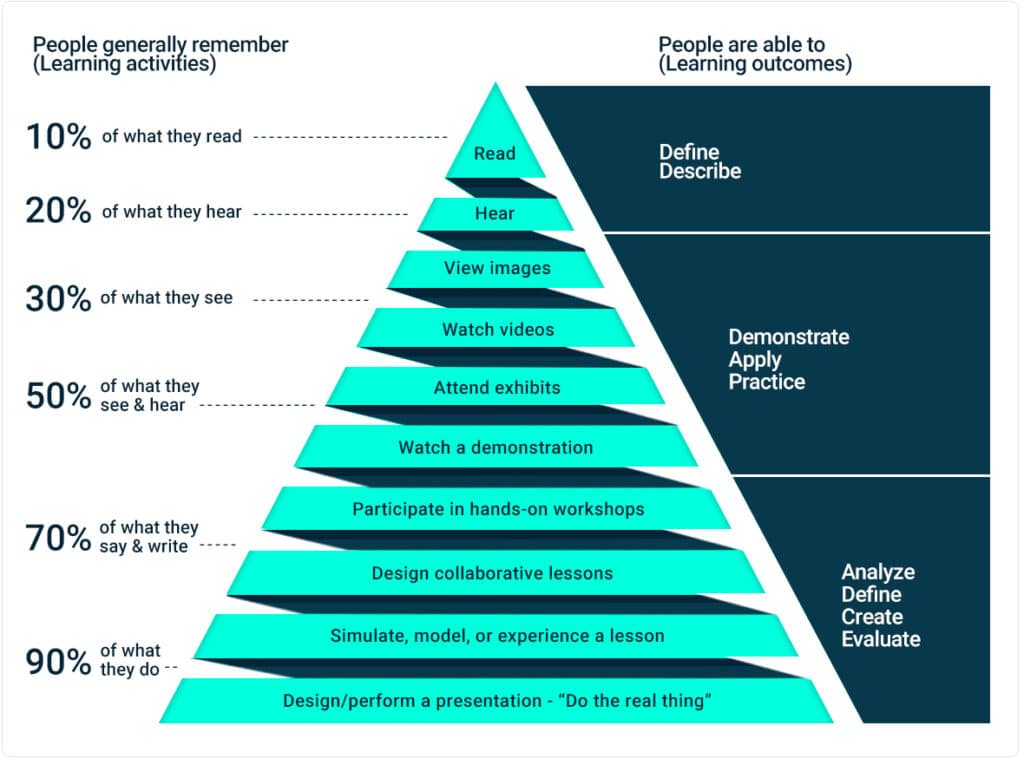
The cone provides some clear recommendations. If we want people to learn optimally, and remember over the long-term, the best approach is to make them “create” or “do” a presentation. In short, people should “do” the actual thing. This may appear perplexing at first, but its wisdom is simply unquestionable.
Learning and development (L&D) professionals should also enable learners to “speak” and “write” by allowing them to partake in “practical” workshops. Now, if this too appears perplexing, just pass over your skepticism while accepting the wisdom, simply because neuroscientists are undeniably smarter than us.
Ultimately, speaking of visual content, it is more helpful “watching” a presentation than “watching” videos, particularly if the videos have adorable pets. It seems like Edgar Dale even predicted YouTube!
No doubt, many learning experts and intellectuals believe Edgar and his learning methods were just amazing.
The Truth behind the Cone’s Percentage Numbers
Did you know that if someone makes a point with scientific wording, then you are more likely to trust them? Well, there are several studies to support it!
What if I tell you that almost everything discussed up to this point is untrue? Yes, you read it right! So, just wash it off your mind. Sadly, this information has continuously been circulated within the realms of learning – as if it was an established fact from the distant past or a recent discovery by modern neuroscience.
If you have found yourself believing everything mentioned above, you are not alone. Perhaps, most people easily accept such type of misinformation as true.
Let’s now explore how this misinformation has been passed down over decades.
If truth be told, there is no scientific proof to back the percentage numbers in the Cone of Experience. In fact, anyone with a basic understanding of science and research would easily tell that results that are rounded off to numbers ending with “0” or “5” are just not quite reliable. Moreover, no scientific research to date on learning supports these percentage numbers.
Historical Background
Not necessarily, people remember less of what they read than what they hear. Similarly, they do not necessarily remember more of what they say and write than what they see and hear. The numbers make no sense – even the order of retention effectiveness is not right. In fact, studies on human learning depict that there is a great deal of variability in how much people remember.
Between 1914 and 1922, these percentage numbers were first mentioned. In multiple publications, these numbers were marked as long-established findings, but without referring to any particular research. It is, in fact, a classic example of how misinformation flows from publication to publication, and then from person to person. Indeed, it was found that there are at least eight commonly cited publications where one can view the percentage research in its basic form. Shockingly, none of these publications had any research mentioned to back the numbers!
Edgar Dale did create the Cone of Experience, but he certainly didn’t put any numbers to it. Here’s the cone’s image from his book’s original version.
The Original Cone of Experience
Certainly, Dale never wanted to make his cone prescriptive. Simply put, he would never expect us to use it for making key decisions related to instructional design. In fact, the cone was created as a descriptive model, depicting the 1940s’ learning landscape.
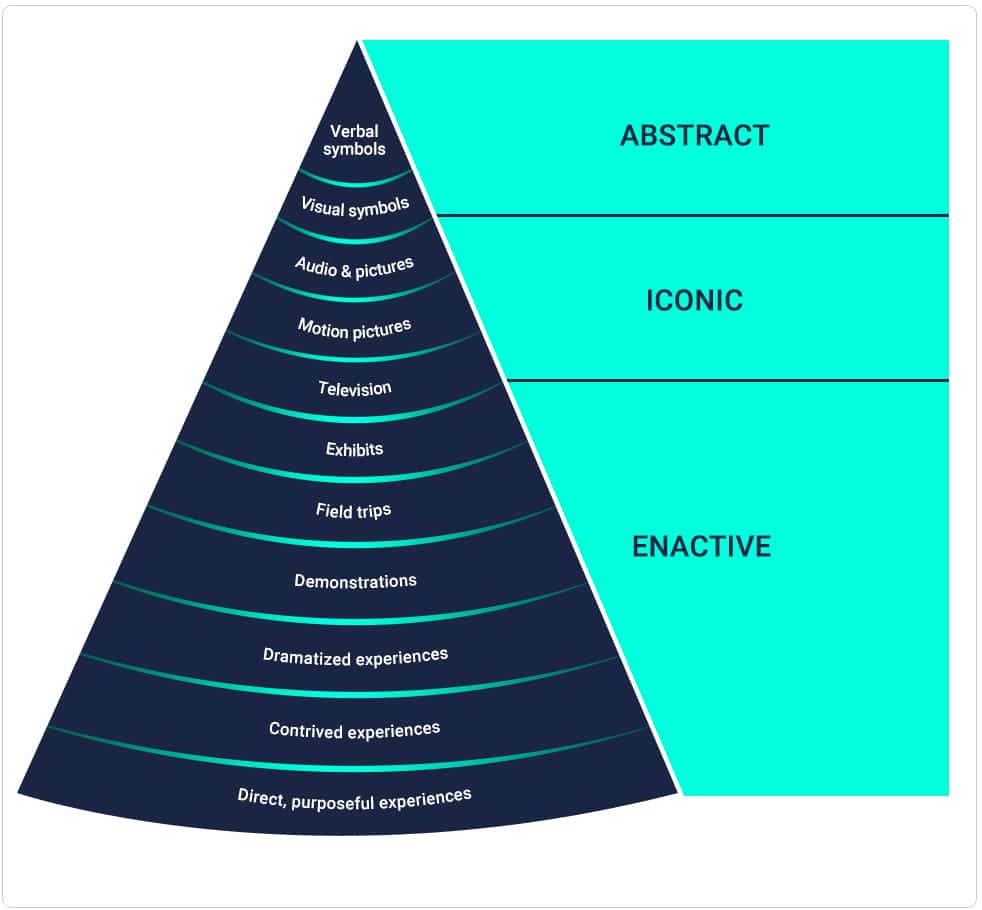
The Actual Edgar’s Cone of Experience
It is basically a learning model developed by Edgar Dale that depicts the levels of concreteness with respect to learning experiences on the basis of mediums. Despite its conical shape, once should not consider it as a basis to decide what mediums are the most (or least) effective. Plus, its levels are not arranged in the right order.
The Different Levels of the Cone of Experience
While the original Cone of Experience had 11 levels, the modern versions of it have only 10 levels. Discussed below are the 11 levels of the cone from top to bottom.
#1 Verbal Symbols
Includes text and words like rules, terminologies, formulas, and other similar stuff. It’s situated at the top of the cone. This means, it provides the most abstract learning experience because of no visual representation. For instance, the word “cloud” doesn’t appear like what it is.
#2 Visual Symbols
Includes graphical representations, such as diagrams, charts, infographics, flowcharts, graphs, etc. Arrows, for instance, depict the flow of a stepwise process.
#3 Recordings, Radio, and Pictures
Includes photographs and audio files like podcasts. By putting images and audio together at the same level, the model helps to break the myth that auditory media is better than visual media. For example, audio recordings are used to teach employees how to pronounce specific words.
#4 Motion Pictures
Refer to the next point.
#5 Educational Television
Recent publications consider motion pictures and educational television at the same level because both are similar mediums. However, they were described as two separate levels in the original Edgar’s model. These two levels are largely about video-based learning which uses both auditory and visual senses.
#6 Exhibits
This level refers to relevant displays with various levels of engagement – some exhibits are merely observational, while others are interactive. From this level, the Cone of Experience starts to move away from abstractness. Museums and galleries are examples of exhibits.
#7 Field Trips/Study Trips
At this level, learners observe various objects, activities, situations, and other related information in an actual setting. For instance, on a trip to a fire station, learners try out how to use a fire extinguisher to stop a fire.
#8 Demonstrations
Demonstrations visually explain how a thing works, acting as a visual guide on how to perform a task. At this level, people learn from seeing others perform a real task.
#9 Dramatized Experiences
Dramatized experiences involve recreating situations, based on real-life incidents, where learners can take part directly. For example, role-plays.
#10 Contrived Experiences
This level includes replicated or modified versions of a real situation, such as simulations, mock-ups, gamification, and models. This type of learning experience makes it easier to understand a concept.
#11 Direct Purposeful Experiences
These are about hands-on learning or practicing a real thing. Situated at the base of Edgar’s cone, it provides the most tangible and concrete learning experience.
The True Purpose of the Cone of Experience
The cone’s main aim is to aid you in choosing the right resources and audiovisual mediums for training. It shouldn’t be considered as a roadmap for a concept or subject – or define either the least or most effective learning experiences.
In learning & development (L&D), once can use the Cone of Experience to create rich learning experiences. You can do so by employing varied training strategies, techniques, and methods to make learning more engaging and improve learning outcomes.
Additionally, one can use it as a guide while developing learning resources. This is because it will help you strike a balance between abstract and concrete learning experiences.
Although it might appear overwhelming, applying them can be effortless with an easy-to-use all-in-one training platform, where you can apply different learning strategies to meet your learning goals.
uQualio is a cloud-based video training platform, where you can deploy various learning strategies and techniques, easily and effectively. It has gamification, microlearning, self-help video guides, and much more to make learning fun, rewarding, effective, and affordable for everyone.